2016-03-01: Hard Boundaries in 2014/15
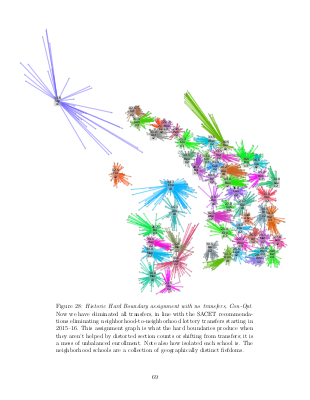
This is how the existing hard boundaries would have assigned the 2014-15 kindergarten class to schools, with properly utilized buildings and no neighborhood transfers:
This is taken from v3.0 of our SNM paper. The full explanation of this graph is in Chapter 7, but briefly:
- Gray dots are students; gray boxes are schools.
- In each school box:
- The bottom number ("x2") is the section count (# of kindergarten classrooms).
- The top number is the section size (# of students per classroom).
- The section counts are "optimal section counts" derived from PPS's "School Optimal Building Size Analysis".
- A colored line connects each student to her neighborhood school.
Copyright 2016, Brooke Cowan and Matthew Marjanovic

